PhpStorm is a great IDE for php development, it is powerful, light and fully featured.
Actually I am a fan of all JetBrains IDEs, these guys know exactly what developers want.
It is quite simple to configure it so you can debug your php code, you can add breakpoints, stop code execution, analyze variables. Debugging gives you a whole new level of help while developing. So here's how to do it:
1- Open your php.ini located in your php installation folder.
2- Add the following code, changing folders to your actual php location, this example is for xampp on windows:
[XDebug]
zend_extension = "C:\xampp\php\ext\php_xdebug.
xdebug.profiler_append = 0
xdebug.profiler_enable = 1
xdebug.profiler_enable_trigger = 0
xdebug.profiler_output_dir = "C:\xampp\tmp"
xdebug.profiler_output_name = "cachegrind.out.%t-%s"
xdebug.remote_enable = 1
xdebug.remote_handler = "dbgp"
xdebug.remote_host = "127.0.0.1"
xdebug.remote_port = 9000
xdebug.trace_output_dir = "C:\xampp\tmp"
OBS: under linux or mac, xdebug will be a .so file under /etc/php/extensions folder
OBS: under linux or mac, xdebug will be a .so file under /etc/php/extensions folder
3- Restart apache on xampp, this enables Xdebug
If you have trouble enabling Xdebug like this or don't have xdebug installed yet you can use the phpinfo() output to auto-build a config step-by-step for you here: http://xdebug.org/wizard.php
If you have trouble enabling Xdebug like this or don't have xdebug installed yet you can use the phpinfo() output to auto-build a config step-by-step for you here: http://xdebug.org/wizard.php
Now for Phpstorm configs:
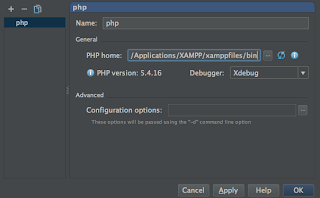
5- Go to Project Settings > PHP
8- PHP Home = your php home, ex: C:\xampp\php
9- Debugger = Xdebug
10- Click OK to close dialogs
11- Now go to Run > Debug... > Edit Configurations
12- + sign > PHP Web Application > click ... On the side of server
15- At the toolbar, next to the bug button there is a telephone with a bug next to it and a block sign, click it to enable debugging


No comments:
Post a Comment